Regulator & disease
Table of contents
About
FerrDb is the world’s first manually curated database for regulators and markers of ferroptosis and ferroptosis-disease associations. It will be routinely updated to support long-term service. The data in FerrDb is free to download and use.
Ferroptosis is a new mode of regulated cell death that depends on iron. Cells die from the toxic accumulation of lipid reactive oxygen species inside. It is tightly linked to a variety of human diseases, such as cancers and degenerative diseases. The ferroptotic process is complicated and consists of a wide range of metabolites and biomolecules. Even though great progress has been achieved, the mechanism of ferroptosis remains enigmatic. We are in an era of knowledge explosion, so it is of importance to find ways to organize and utilize data efficiently. We noticed there lacks high-quality knowledgebase in ferroptosis research, so the database was created.
Abbreviations
| Abbr. | Definition |
|---|---|
| _NA_ | Not available because of no resource data, or not applicable |
| System Xc- | Cystine/glutamate antiporter |
| NADPH | Nicotinamide adenine dinucleotide phosphate |
| NOX | Nicotinamide adenine dinucleotide phosphate oxidase |
| GSH | Glutathione |
| alpha-KG | alpha-ketoglutarate |
| Gln | Glutamine |
| Glu | Glutamate |
| xCT | Light chain of System Xc- |
| PUFA(s) | Polyunsaturated fatty acid(s) |
| 5-HETE | 5-hydroxyeicosatetraenoic acid |
| PE | Phosphatidylethanolamine |
| AA | Arachidonoyl |
| AdA | Adrenoyl |
| LDH | Lactate dehydrogenase |
| 8-OHdG | 8-hydroxydeoxyguanosine |
| PUFAs | Polyunsaturated fatty acids |
| MDA | Lipid Peroxidation |
| MVB | Multivesicular body |
| RNS | Reactive nitrogen species |
Confidence level
| Confidence | Explanation |
|---|---|
| Validated | The most reliable. It requires convincing evidence from strict tests such as pharmacological or genetic inhibition or activation test. |
| Screened | No strict validation. Only high-throughput data is available. |
| Predicted | No strict validation. In the source article, the original authors drew their conclusions based on computational results or their knowledge. |
| Deduced | No strict validation. We, the curators, inferred the gene's function based on our understanding of the original article. |
Glossary
| Term | Definition |
|---|---|
| Regulator | A gene or small molecule that participants in the regulation of ferroptosis. |
| Driver | A gene that promotes ferroptosis. |
| Suppressor | A gene that prevents ferroptosis. |
| Marker | A gene that indicates the occurrence of ferroptosis. |
| Inducer | A small molecule which enables to cause ferroptosis. |
| Inhibitor | A small molecule which enables to restrict ferroptosis. |
Browse data
Click Browse in the navigation bar to open the drop-down menu that provides access to individual data set.
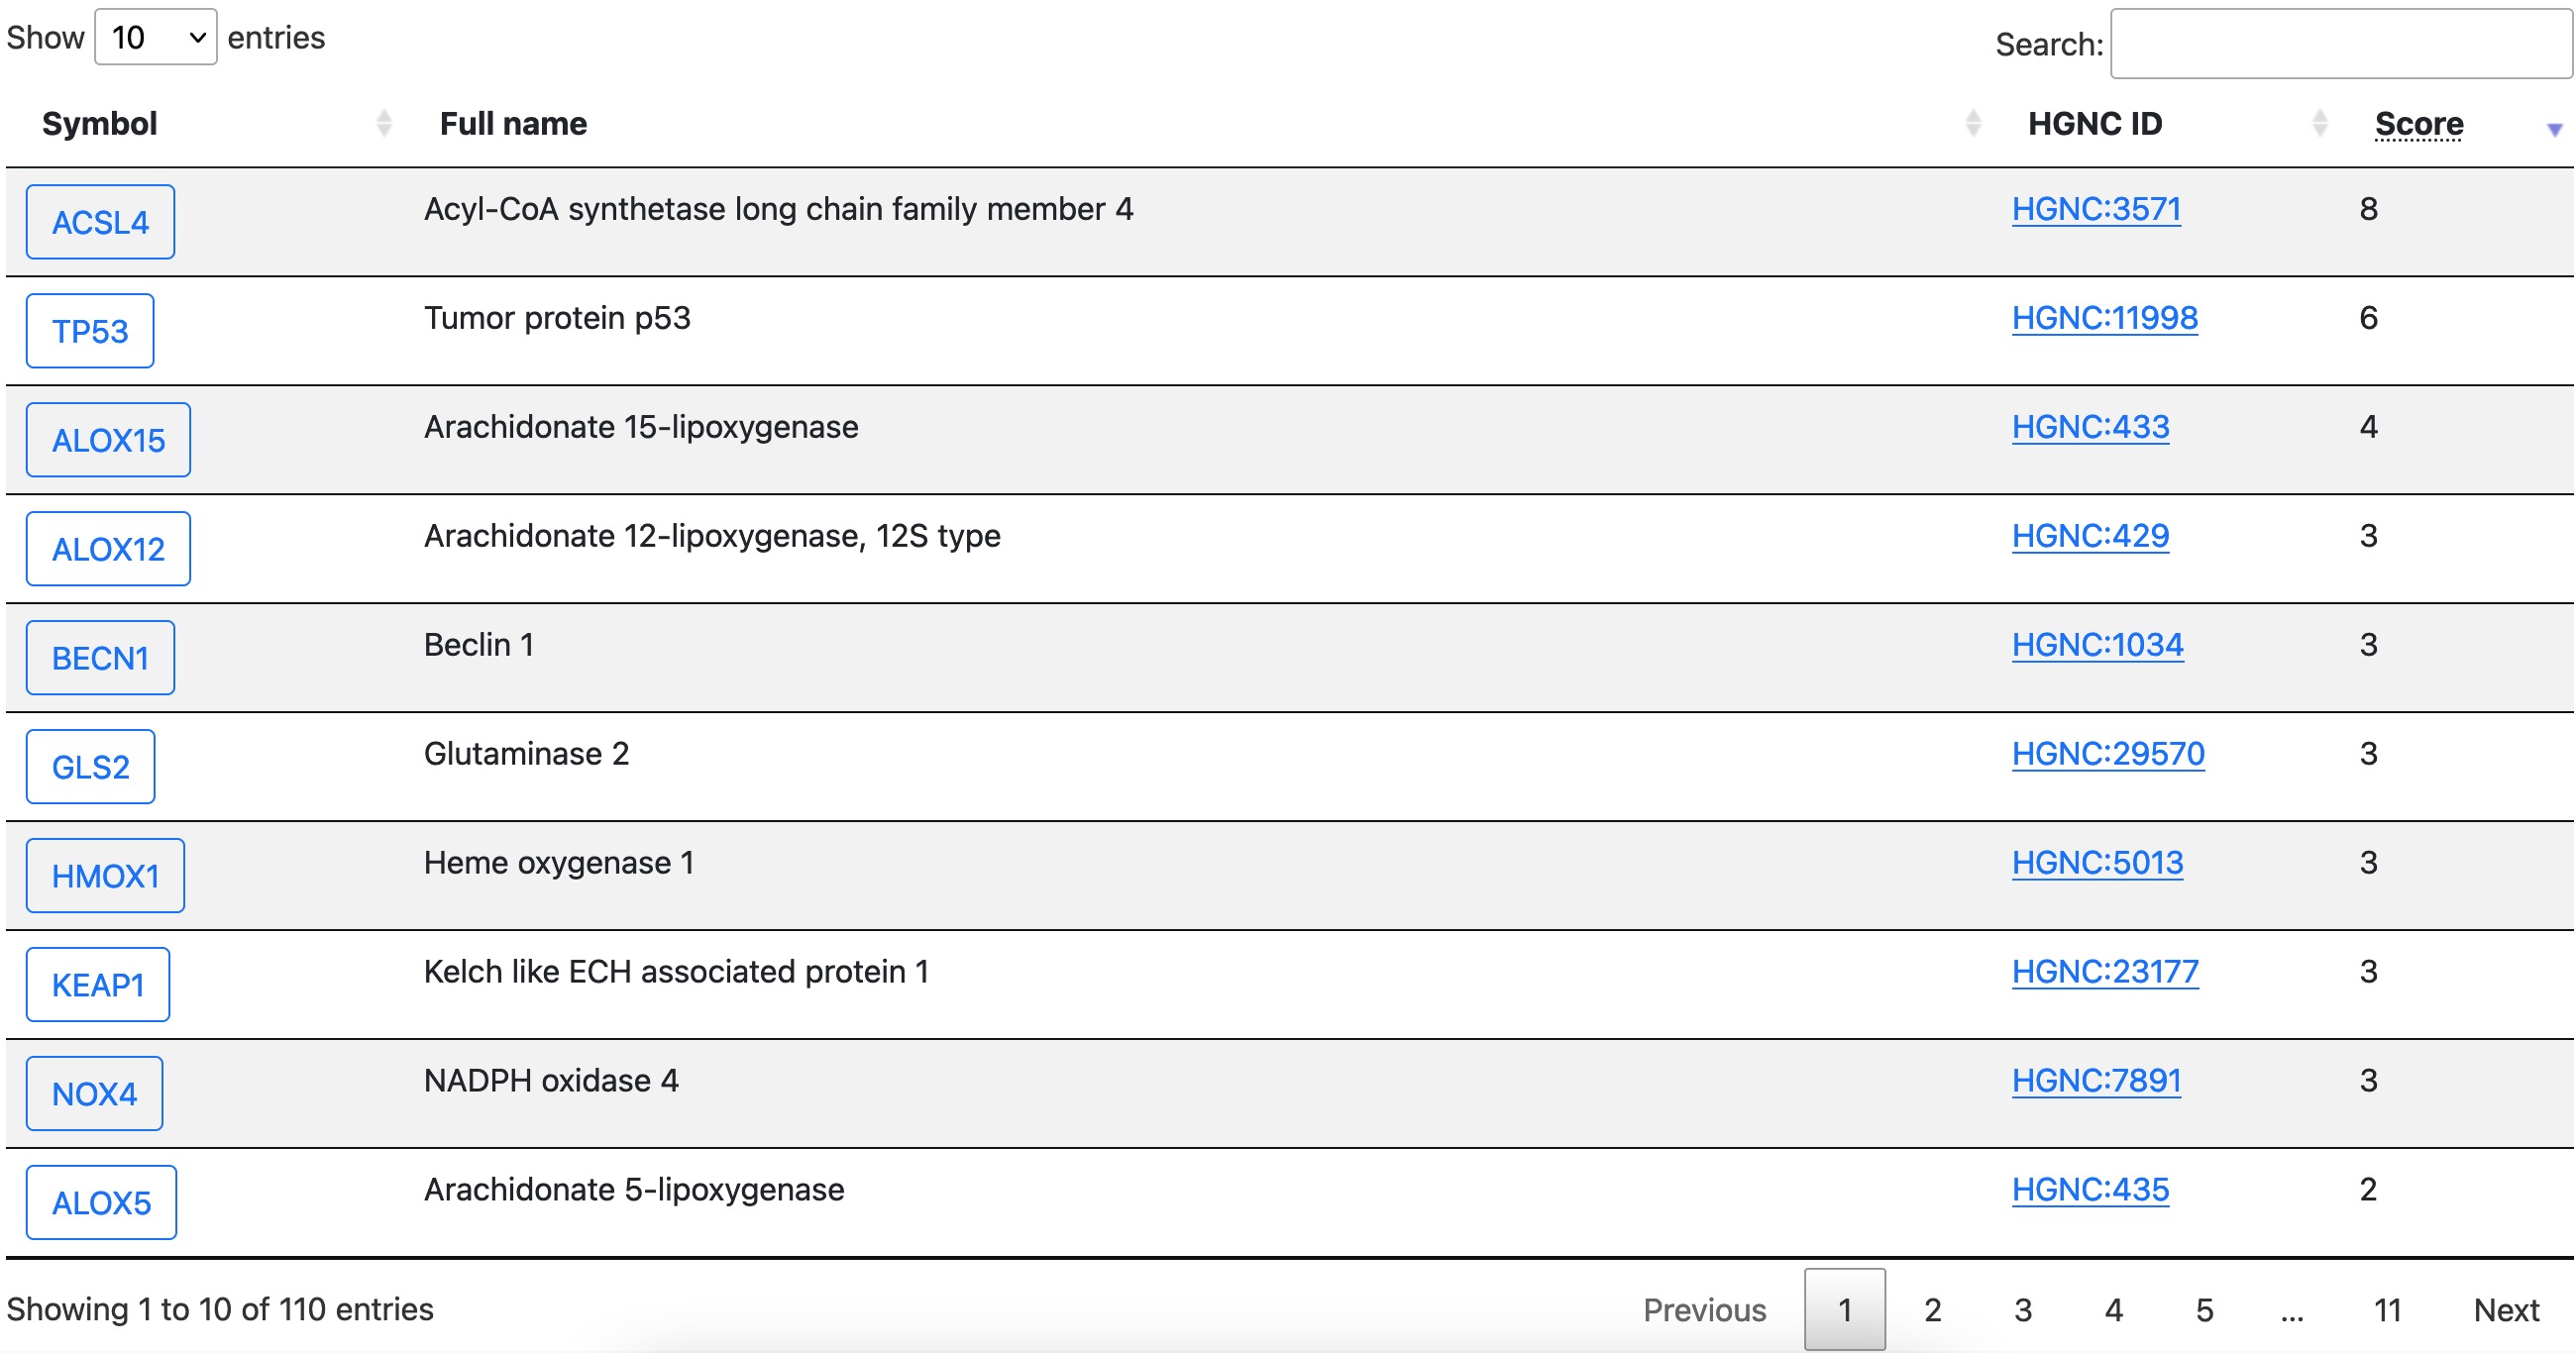
Driver, suppressor, and marker are presented in the same/similar format. As shown in the following graph, each row is a regulator and features are shown in columns.

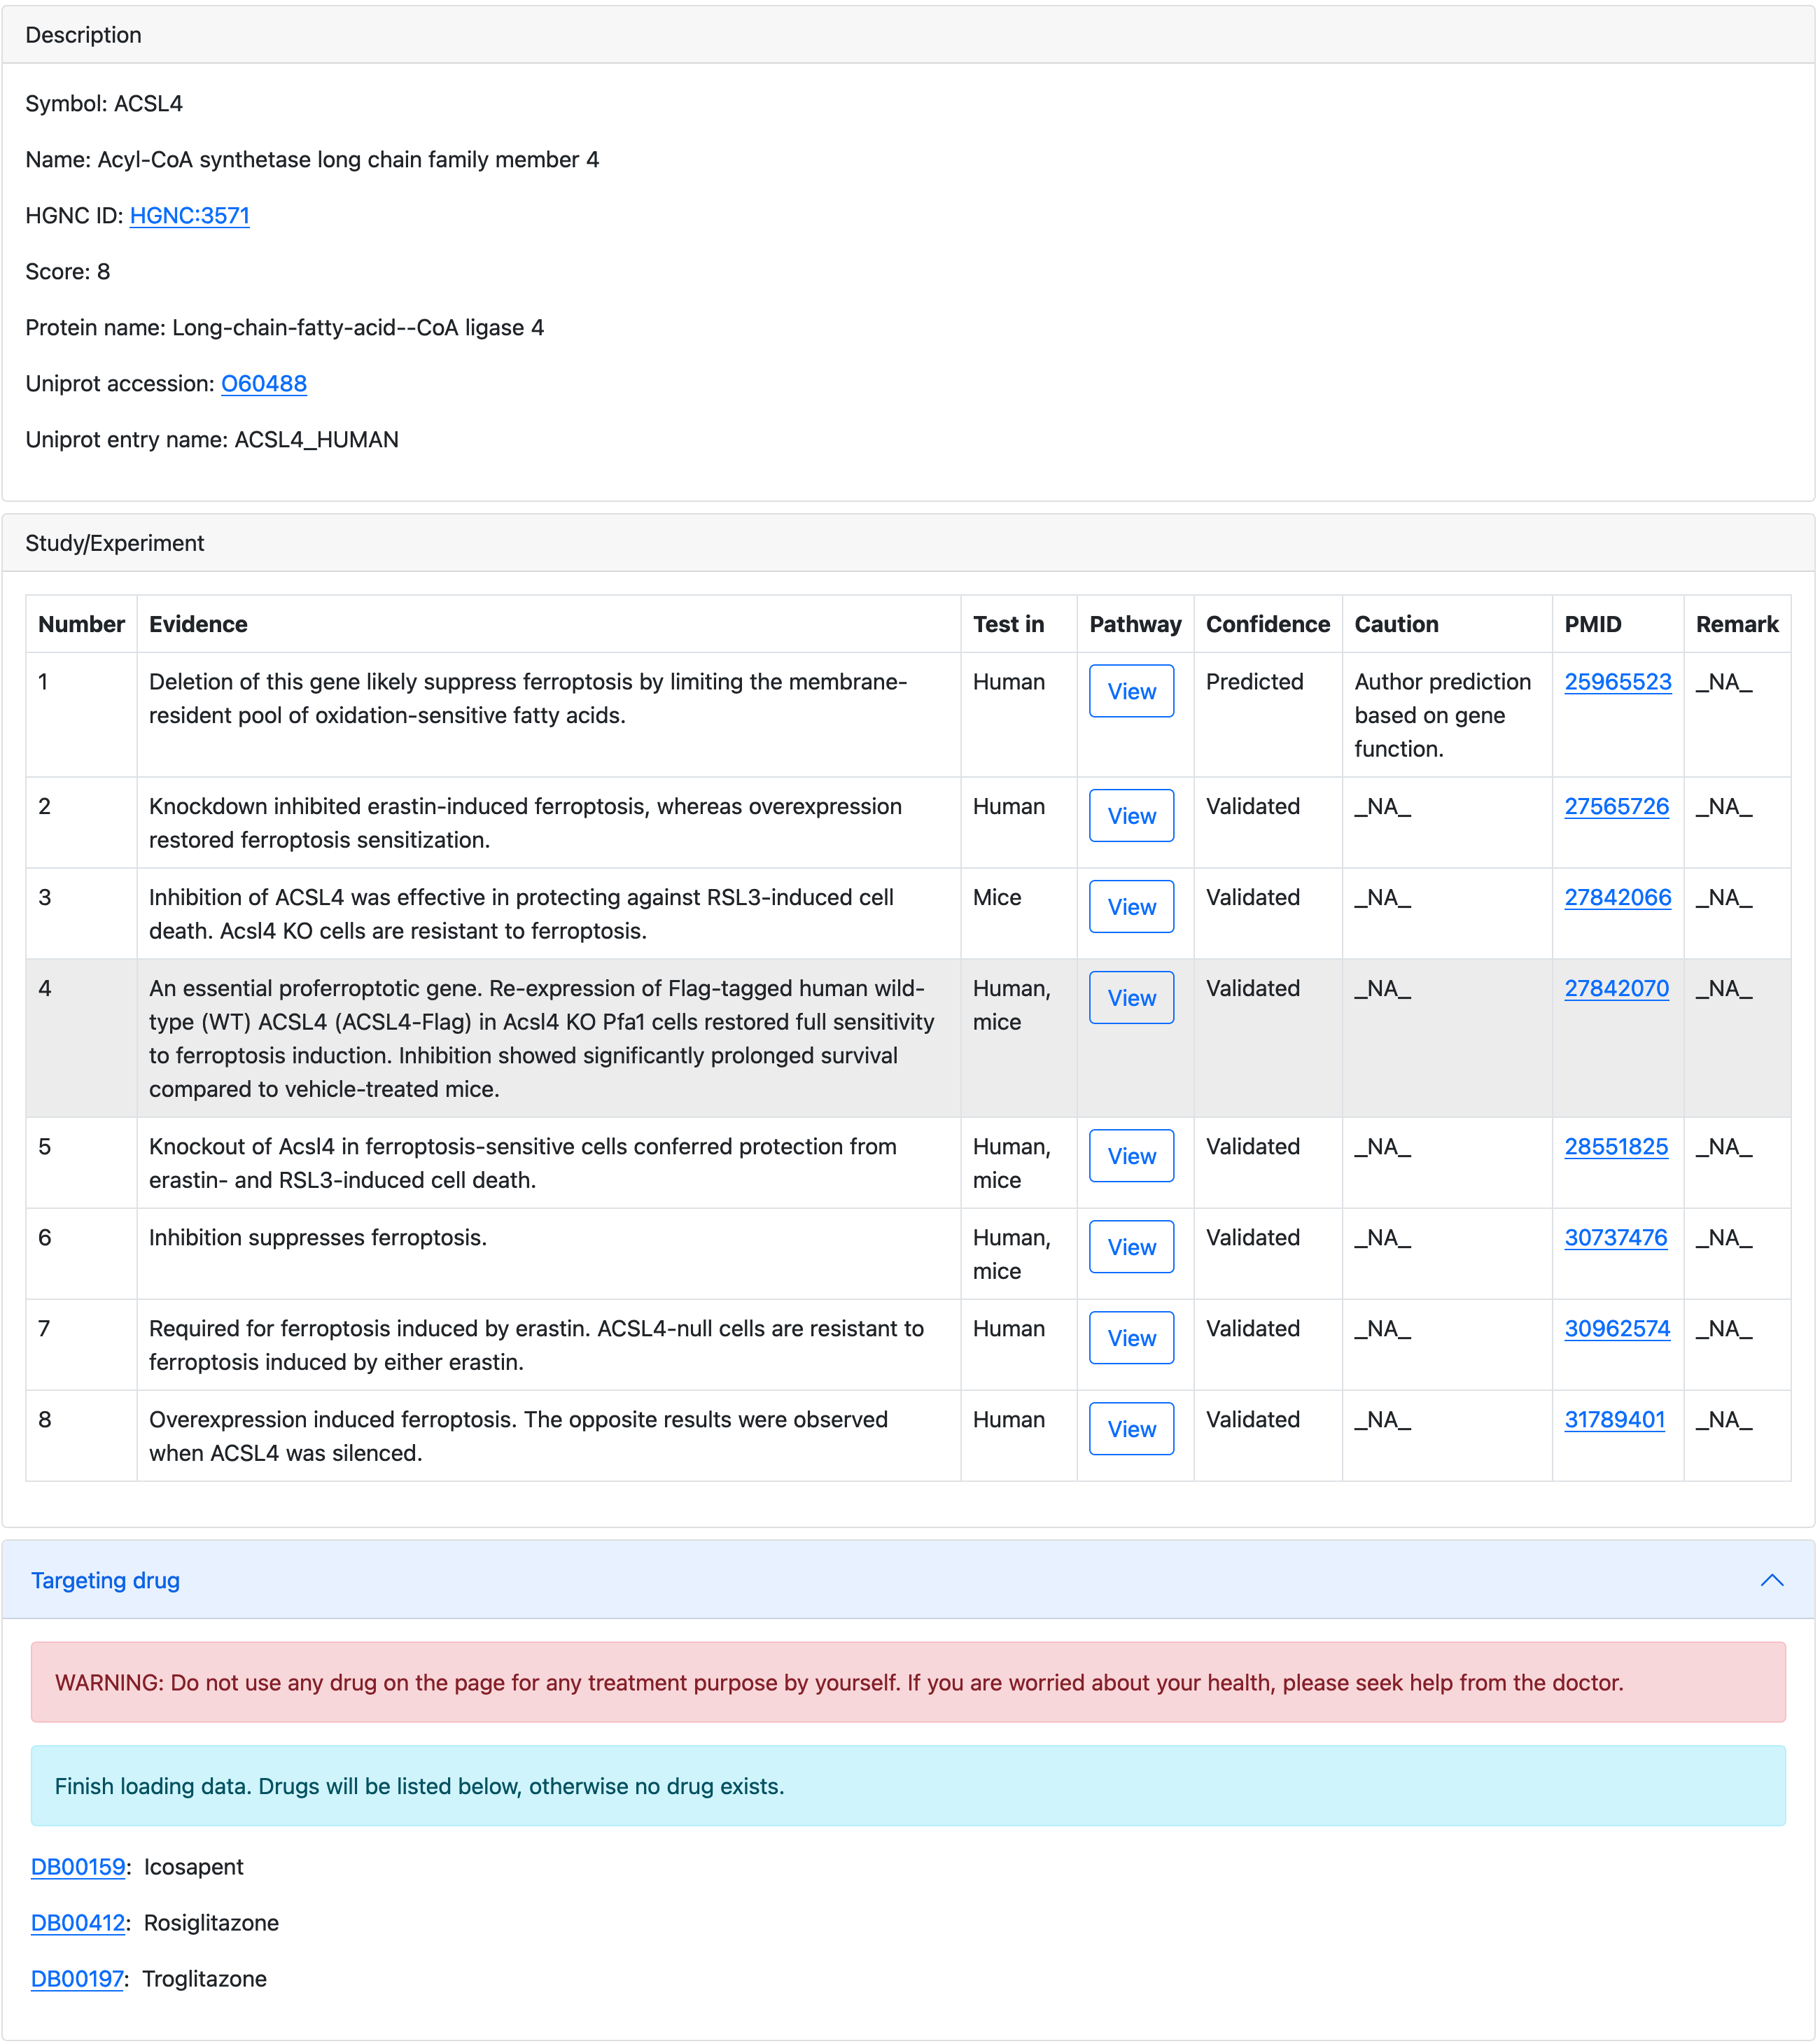
Click the symbol in the first column in this table to open the detail page of that gene.

The latest update column shows when the item was last updated. Please be notified that for items that have already been in FerrDb since version 1 (FerrDb v1), the latest update date is set to 2020/12/31. Since version 2 (FerrDb v2), the latest update is set to the date of inclusion or modification of the item.
Download data
Please go to the Download page to get the data.
Submit data
We appreciate your contribution. Please go to the Submit page and follow the guidance on that page to submit data to the database.
Use utilities
Regulation network
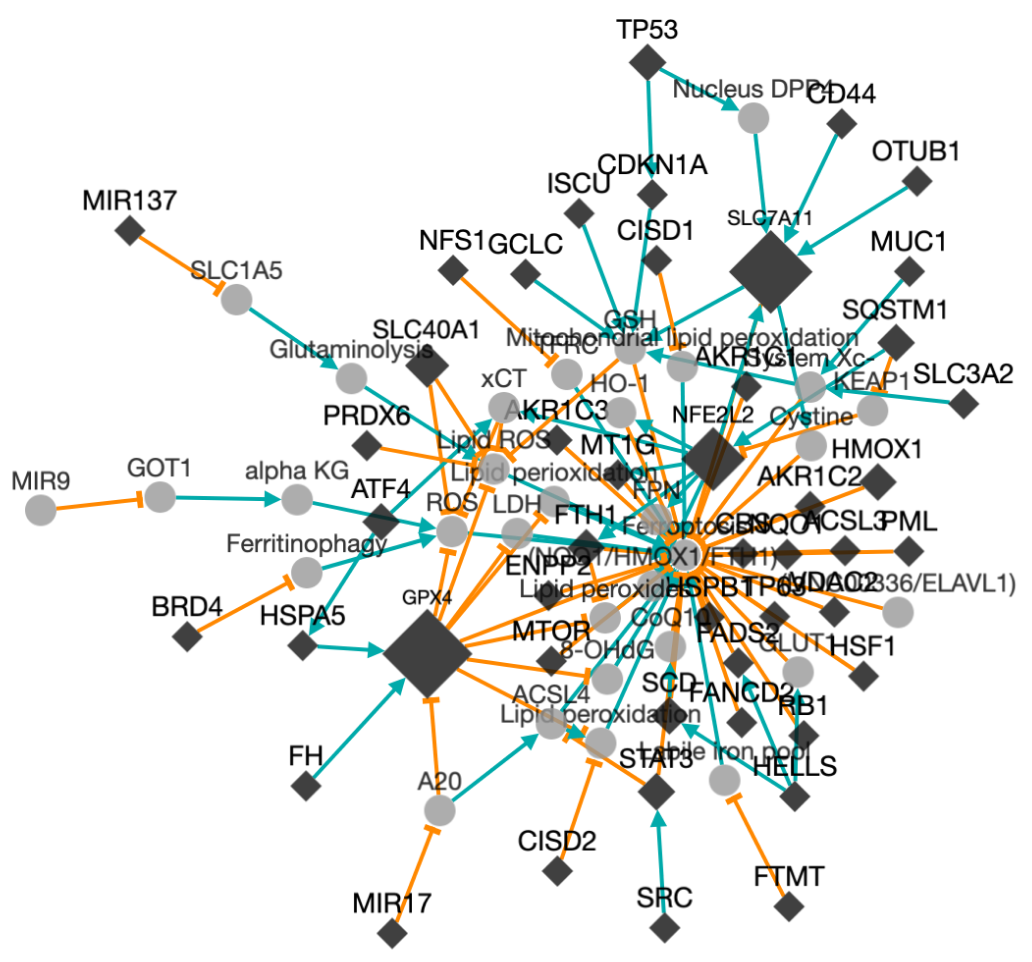
Under the Utilities drop-down, click Regulation network, and then a regulation network will show. Black diamond denotes ferroptosis regulator (e.g., gene), grey circle denotes other regulatory elements involved, orange line with a tee head represents promoting effect, and grass green line with an arrow head represents inhibiting effect. The size of diamond indicates experiment count. The more the number of experiments, the larger the node size.

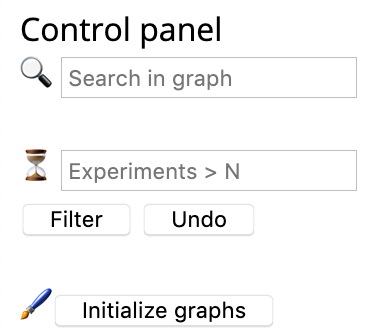
Users can play with the regulation network with tools from the control panel, such as finding a gene of their interest and filtering out genes with more than N experiments. If you unfortunately mess up things, no worries, you can press the Initialize graph button to get the page tidy.

Enrichment analysis
Enrichment analysis enables users to know whether a gene list of their interest is statistically enriched in any ferroptosis gene set annotated in FerrDb.
▶ Over-representation test is a type of gene set enrichment analysis. The process of over-representation
test can be resembled by randomly picking balls from a bowl. Suppose that there are M balls in
a bowl and n balls were marked (e.g., black balls). What is the probability of getting
≥x marked balls after randomly drawing N balls from the bowl?
Here, the problem is solved by hypergeometic test. The test is implemented in python using the
hypergeom.sf method provided in scipy.stats. The script snippet for p value calculation is
hypergeom.sf(x-1, M, n, N). To calculate FDR,
p values are adjusted using the
Benjamini & Hochberg method:
(1) rank p values in ascending order, then multiply each p value by the total number of tests
and divide by its rank order;
(2) make sure that the resulting sequence is non-decreasing, i.e.,
if it ever starts decreasing, make the preceding p value equal to the subsequent
(repeatedly, until the whole sequence becomes non-decreasing);
(3) If any p value ends up larger than 1, make it equal to 1. The calculation is implemented
as a python function:
                        def bh_fdr(p_vals=None):
                            """
                            Calculate fdr using BH (Benjamini & Hochberg) method, resembling p.adjust in R
                            :param p_vals: a sequence of p values
                            :return: adjusted p values in the same order as the input sequence
                            """
                            p_vals = np.array(p_vals)
                            order_p_values = rankdata(p_vals, 'ordinal')
                            # sort in ascending and adj p
                            p_vals.sort()
                            fdr = p_vals * len(p_vals) / (np.arange(len(p_vals)) + 1)
                            # Second, make sure that the resulting sequence is non-decreasing
                            # if it ever starts decreasing, make the preceding p value equal to the subsequent, repeated as required
                            while not np.all(rankdata(fdr, 'ordinal') == np.arange(len(fdr)) + 1):
                                for iii in range(len(fdr) - 1):
                                    if fdr[iii] > fdr[iii + 1]:
                                        fdr[iii] = fdr[iii + 1]
                            # If any p value ends up larger than 1, make it equal to 1
                            fdr[fdr > 1] = 1
                            # sort back
                            fdr = fdr[np.r_[order_p_values - 1]]
                            return fdr.tolist()
▶ Subramanian et al.'s GSEA method is another popular way for enrichment analysis. Simply speaking, we implemented the GSEA analysis as follows.
- Rank genes based on user-defined score.
- Walk along the ranked gene list to calculate running enrichment score (RES). If a gene exists in the known gene set, RES = RES + |∆Increment|. If a gene does not exist in the set, RES = RES - |∆Decrement|. At the end, assign the largest RES to enrichment score (ES).
- Calculate p value by permutation test (default to 100 permutations).
- Calculate NES by dividing ES by the mean of the ES from the permutation test, and then estimate FDR separately for negative and positive NES.
Gene symbol validation
With this utility, it is easy for us to keep FerrDb accurate and up to date. It will automatically search the HGNC database and check whether there are discrepancies in terms of gene symbol between FerrDb and HGNC. Unmatched items will be highlighted, so they can be fixed in time.
Feedback
We value your voice. Please send an email to the webmaster at admin@zhounan.org, if you have any comments.